

Stata Overview

Fast, accurate, and easy to use
With both a point-and-click interface and a powerful, intuitive command syntax, Stata is fast, accurate, and easy to use. All analyses can be reproduced and documented for publication and review. Version control ensures statistical programs will continue to produce the same results no matter when you wrote them.
Broad suite of statistical features
Stata puts hundreds of statistical tools at your fingertips:
Basic statistics
summaries • cross-tabulations • correlations • z and t tests • equality-of-variance tests • tests of proportions • confidence intervals • factor variables • more
Linear models
regression • censored outcomes • endogenous regressors • bootstrap, jackknife, and robust and cluster–robust variance • instrumental variables • three-stage least squares • constraints • quantile regression • GLS • more
Panel/longitudinal data
random and fixed effects with robust standard errors • linear mixed models • random-effects probit • GEE • random- and fixed-effects Poisson • dynamic panel-data models • instrumental variables • panel unit-root tests • more
Multilevel mixed-effects models
continuous, binary, count, and survival outcomes • two-, three-, and higher-level models • generalized linear models • nonlinear models • random intercepts • random slopes • crossed random effects • BLUPs of effects and fitted values • hierarchical models • residual error structures • DDF adjustments • support for survey data • more
Binary, count, and limited outcomes
logistic, probit, tobit • Poisson and negative binomial • conditional, multinomial, nested, ordered, rank-ordered, and stereotype logistic • multinomial probit • zero-inflated and left-truncated count models • selection models • marginal effects • more
Extended regression models (ERMs)
combine endogenous covariates, sample selection, and nonrandom treatment in models for continuous, interval-censored, binary, and ordinal outcomes • more
Generalized linear models (GLMs)
ten link functions • user-defined links • seven distributions • ML and IRLS estimation • nine variance estimators • seven residuals • more
Finite mixture models (FMMs)
fmm: prefix for 17 estimators • mixtures of a single estimator • mixtures combining multiple estimators or distributions • continuous, binary, count, ordinal, categorical, censored, truncated, and survival outcomes • more
Spatial autoregressive models
spatial lags of dependent variable, independent variables, and autoregressive errors • fixed and random effects in panel data • endogenous covariates • analyze spillover effects • more
ANOVA/MANOVA
balanced and unbalanced designs • factorial, nested, and mixed designs • repeated measures • marginal means • contrasts • more
Exact statistics
exact logistic and Poisson regression • exact case–control statistics • binomial tests • Fisher’s exact test for r × c tables • more
Linearized DSGE models
specify models algebraically • solve models • estimate parameters • identification diagnostics • policy and transition matrices • IRFs • dynamic forecasts • more
Tests, predictions, and effects
Wald tests • LR tests • linear and nonlinear combinations • predictions and generalized predictions • marginal means • least-squares means • adjusted means • marginal and partial effects • forecast models • Hausman tests • more
Contrasts, pairwise comparisons, and margins
compare means, intercepts, or slopes • compare with reference category, adjacent category, grand mean, etc. • orthogonal polynomials • multiple-comparison adjustments • graph estimated means and contrasts • interaction plots • more
Simple maximum likelihood
specify likelihood using simple expressions • no programming required • survey data • standard, robust, bootstrap, and jackknife SEs • matrix estimators • more
Programmable maximum likelihood
user-specified functions • NR, DFP, BFGS, BHHH • OIM, OPG, robust, bootstrap, and jackknife SEs • Wald tests • survey data • numeric or analytic derivatives • more
Resampling and simulation methods
bootstrap • jackknife • Monte Carlo simulation • permutation tests • more
Time series
ARIMA • ARFIMA • ARCH/GARCH • VAR • VECM • multivariate GARCH • unobserved-components model • dynamic factors • state-space models • Markov-switching models • business calendars • tests for structural breaks • threshold regression • forecasts • impulse–response functions • unit-root tests • filters and smoothers • rolling and recursive estimation • more
Survival analysis
Kaplan–Meier and Nelson–Aalen estimators, • Cox regression (frailty) • parametric models (frailty, random effects) • competing risks • hazards • time-varying covariates • left-, right-, and interval-censoring • Weibull, exponential, and Gompertz models • more
Bayesian analysis
thousands of built-in models • univariate and multivariate models • linear and nonlinear models • multilevel models • continuous, binary, ordinal, and count outcomes • bayes: prefix for 45 estimation commands • continuous univariate, multivariate, and discrete priors • add your own models • convergence diagnostics • posterior summaries • hypothesis testing • model comparison • more
Power and sample size
power • sample size • effect size • minimum detectable effect • means • proportions • variances • correlations • ANOVA • regression • cluster randomized designs • case–control studies • cohort studies • contingency tables • survival analysis • balanced or unbalanced designs • results in tables or graphs • more
Treatment effects/Causal inference
inverse probability weight (IPW) • doubly robust methods • propensity-score matching • regression adjustment • covariate matching • multilevel treatments • endogenous treatments • average treatment effects (ATEs) • ATEs on the treated (ATETs) • potential-outcome means (POMs) • continuous, binary, count, fractional, and survival outcomes • more
SEM (structural equation modeling)
graphical path diagram builder • standardized and unstandardized estimates • modification indices • direct and indirect effects • continuous, binary, count, ordinal, and survival outcomes • multilevel models • random slopes and intercepts • factor scores, empirical Bayes, and other predictions • groups and tests of invariance • goodness of fit • handles MAR data by FIML • correlated data • survey data • more
Latent class analysis
binary, ordinal, continuous, count, categorical, fractional, and survival items • add covariates to model class membership • combine with SEM path models • expected class proportions • goodness of fit • predictions of class membership • more
Multiple imputation
nine univariate imputation methods • multivariate normal imputation • chained equations • explore pattern of missingness • manage imputed datasets • fit model and pool results • transform parameters • joint tests of parameter estimates • predictions • more
Survey methods
multistage designs • bootstrap, BRR, jackknife, linearized, and SDR variance estimation • poststratification • DEFF • predictive margins • means, proportions, ratios, totals • summary tables • almost all estimators supported • more
Cluster analysis
hierarchical clustering • kmeans and kmedian nonhierarchical clustering • dendrograms • stopping rules • user-extensible analyses • more
IRT (item response theory)
binary (1PL, 2PL, 3PL), ordinal, and categorical response models • item characteristic curves • test characteristic curves • item information functions • test information functions • differential item functioning (DIF) • more
Multivariate methods
factor analysis • principal components • discriminant analysis • rotation • multidimensional scaling • Procrustean analysis • correspondence analysis • biplots • dendrograms • user-extensible analyses • more
Data management
data transformations • match-merge • import/export data • ODBC • SQL • Unicode • by-group processing • append files • sort • row–column transposition • labeling • save results • more
Graphics
lines • bars • areas • ranges • contours • confidence intervals • interaction plots • survival plots • publication quality • customize anything • Graph Editor • more
Graphical user interface
menus and dialogs for all features • Data Editor • Variables Manager • Graph Editor • Project Manager • Do-file Editor • Clipboard Preview Tool • multiple preference sets • more
Basic statistics
summaries • cross-tabulations • correlations • z and t tests • equality-of-variance tests • tests of proportions • confidence intervals • factor variables • more
Nonparametric methods
nonparametric regression • Wilcoxon–Mann–Whitney, Wilcoxon signed ranks, and Kruskal–Wallis tests • Spearman and Kendall correlations • Kolmogorov–Smirnov tests • exact binomial CIs • survival data • ROC analysis • smoothing • bootstrapping • more
Epidemiology
standardization of rates • case–control • cohort • matched case–control • Mantel–Haenszel • pharmacokinetics • ROC analysis • ICD-10 • more
GMM and nonlinear regression
generalized method of moments (GMM) • nonlinear regression • more
Other statistical methods
kappa measure of interrater agreement • Cronbach's alpha • stepwise regression • tests of normality • more
Functions
statistical • random-number • mathematical • string • date and time • more
Internet capabilities
ability to install new commands • web updating • web file sharing • latest Stata news • more
Community-contributed commands
community-written commands for meta-analysis, data management, survival, econometrics, more
Programming features
adding new commands • command scripting • object-oriented programming • menu and dialog-box programming • dynamic documents • Markdown • Project Manager • plugins • more
Matrix programming—Mata
interactive sessions • large-scale development projects • optimization • matrix inversions • decompositions • eigenvalues and eigenvectors • LAPACK engine • real and complex numbers • string matrices • interface to Stata datasets and matrices • numerical derivatives • object-oriented programming • more
Documentation
36 manuals • 19,000+ pages • seamless navigation • thousands of worked examples • quick starts • methods and formulas • references • more
Complete data-management facilities
Publication-quality graphics
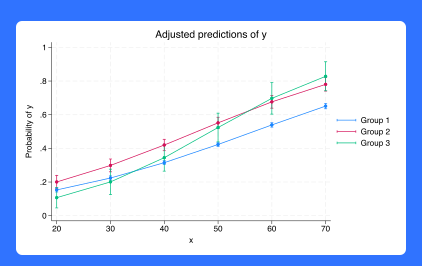
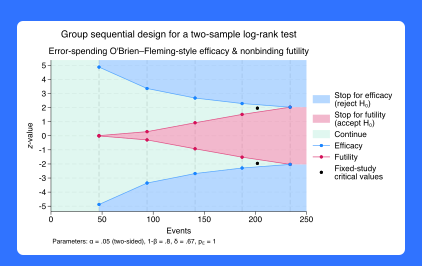
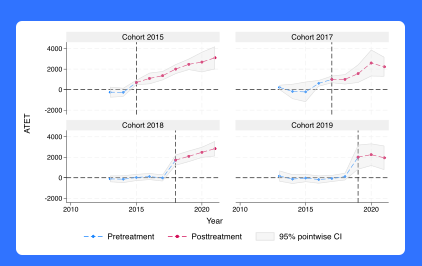
Stata makes it easy to generate publication-quality, distinctly styled graphs.
You can write scripts to produce hundreds or thousands of graphs in a reproducible manner and export them to EPS or TIF for publication, to PNG or SVG for the web, or to PDF for viewing. With the integrated Graph Editor you click to change anything about your graph or to add titles, notes, lines, arrows, and text.
Extensible
Stata is so programmable that developers and users add new features every day to respond to the growing demands of today's researchers.
With Stata's Internet capabilities, new features and official updates can be installed over the Internet with a single click.
Matrix programming with Mata
Mata is a full-blown programming language that compiles what you type into bytecode, optimizes it, and executes it fast.
Though you don't need to program to use Stata, it is comforting to know that a fast and complete matrix programming language is an integral part of Stata. Mata is both an interactive environment for manipulating matrices and a full development environment that can produce compiled and optimized code. It includes special features for processing panel data, performs operations on real or complex matrices, provides complete support for object-oriented programming, and is fully integrated with every aspect of Stata.
Cross-platform compatible
Stata will run on Windows, Mac, and Linux/Unix computers; however, our licenses are not platform specific.
That means if you have a Mac laptop and a Windows desktop, you don't need two separate licenses to run Stata. You can install your Stata license on any of the supported platforms. Stata datasets, programs, and other data can be shared across platforms without translation. You can also quickly and easily import datasets from other statistical packages, spreadsheets, and databases.
Trusted
We don't just program statistical methods, we validate them.
The results you see from a Stata estimator rest on comparisons with other estimators, Monte Carlo simulations of consistency and coverage, and extensive testing by our statisticians. Every Stata we ship has passed a certification suite that includes 4.1 million lines of testing code that produces 6 million lines of output. We certify every number and piece of text from those 6 million lines of output.
Stata in Swedish
If you prefer your menus to be in another language than English, you can choose between Spanish, Japanese, Korean, Chinese, French — and Swedish.
StataNow™
StataNow is is a continuous-release version of Stata that gives users access to new features as soon as they are ready, and at no additional cost. Click here for more information.
The Stata Prof+ Plan
The Stata Prof+ Plan offers exactly the same products and pricing as the old GradPlan. If you have not already explored it, please click here for more information.
Stata Site Licenses for Universities
University-wide site licenses is the most economical and administratively most efficient way of supplying Stata to faculty and students. Many Nordic universitites already have signed site license agreements. Please click here for more details.
Stata Editions
Stata/MP: The fastest Edition of Stata; largest datasets
Stata/SE: Standard Edition; larger datasets
Stata/BE: Basic Edition, mid-sized datasets
Detailed feature description
Most computers purchased since mid 2006 can take advantage of the advanced multiprocessing of Stata/MP. This includes the Intel CoreTM 2 Duo, i3, i5, i7, and the AMD X2 dual-core chips. On dual-core chips, Stata/MP runs 40% faster overall and 72% faster where it matters, on the time-consuming estimation commands. With more than two cores or processors, Stata/MP is even faster. Stata/SE, and Stata/BE differ only in the dataset size that each can analyze.
Stata/SE and Stata/MP can fit models with more independent variables than Stata/BE (up to 10,998). Stata/BE allows datasets with as many as 2,047 variables. The number of observations is limited only by the amount of RAM in your computer. Stata/BE can have at most 798 right-hand-side variables in a model. All the above editions have the same complete set of commands and features and include PDF documentation.
Compare features
| Package | Max. var. | Max. Ind. Var. | Multithreading | Platforms |
| Stata MP | 32 767 | 10 998 | Yes | Win, Mac, Unix |
| Stata SE | 10 998 | 10 998 | No | Win, Mac, Unix |
| Stata BE | 2 047 | 798 | No | Win, Mac, Unix |
All versions of Stata support 64-bit architecture and an unlimited number of observations, only limited by the RAM of the system. Technical differences can be found here.
Multicore performance
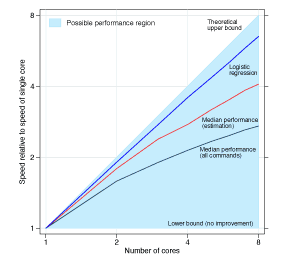
MP licenses can be used on both 32 and 64 bit computers, but they only go faster if your computer has at least the same number of processors as your license, i.e., MP2 will work more efficiently than a SE only if the computer has at least 2 processors. As you can clearly see from the graph, Stata/MP is considerably faster than Stata/SE due to allowing for your computer to fully utilize multithreaded processing.
Compatible operating systems
Stata will run on the platforms listed below. While Stata software is platform-specific, your Stata license is not; therefore, you need not specify your operating system when placing your order for a license.
Stata for Windows
Windows 11
Windows 10*
Windows Server 2019, 2016, 2012R2*
Windows Server 2022
* Stata requires 64-bit Windows for x86-64 processors made by Intel® and AMD
Stata for Mac
* Stata requires a Mac with Apple Silicon or 64-bit Intel processor.
* Stata for Mac requires MacOS 11.0 (Big Sur) or newer for Macs with Apple Silicon and MacOS 10.13 (High Sierra) or newer for Macs with 64-bit Intel processors.
Stata for Linux
Minimum requirements include the GNU C library (glibc) 2.17 or better and libcurl4
Hardware requirements
| Package | Memory | Disk space |
| Stata/MP | 4 GB | 4 GB |
| Stata/SE | 2 GB | 4 GB |
| Stata/BE | 1 GB | 4 GB |
Stata for Unix requires a video card that can display thousands of colors or more (16-bit or 24-bit color).